















Step 1
Upload
Import your CSV or pasted table with wind direction and wind speed columns. Validate units, timestamps, and missing values before generating the wind rose.
Generate wind rose analysis diagrams with AI. Upload wind speed and direction data, customize bins and sectors, and export charts fast—try it now.
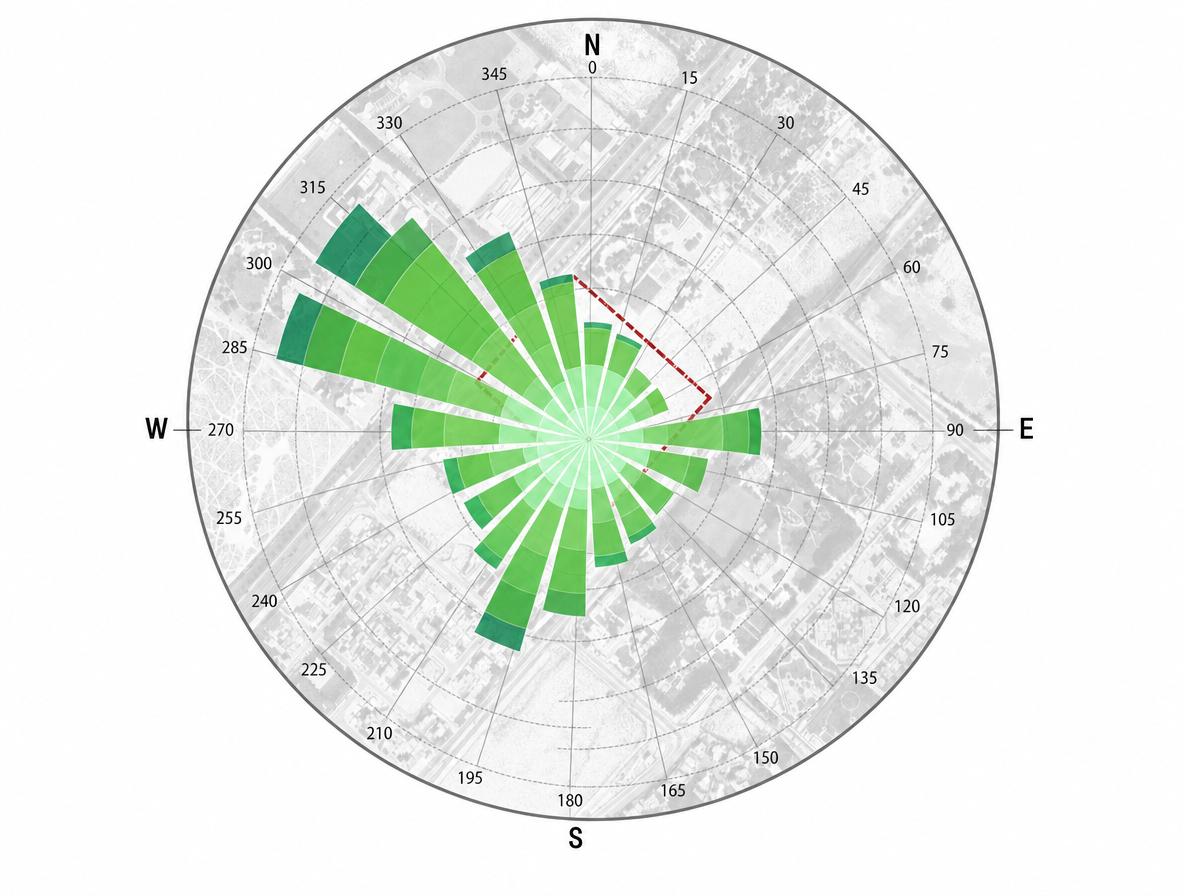
How to use Wind Rose Analysis Diagram
Follow these steps to generate a wind rose analysis diagram from your wind dataset. Configure sectors and speed bins, preview the distribution, and export a chart ready for reporting or sharing.
Step 1
Import your CSV or pasted table with wind direction and wind speed columns. Validate units, timestamps, and missing values before generating the wind rose.

Step 2
Set sector count, direction reference, and wind speed bins. Apply date ranges, hourly filters, or site labels to focus the analysis on specific conditions.

Step 3
Generate the wind rose diagram and review frequency percentages by sector and bin. Export PNG/SVG or download the underlying summary table for documentation.
Features
Build accurate wind rose analysis diagrams from raw wind data with fast, AI-assisted configuration. Customize direction sectors, speed bins, calm thresholds, and time filters to match meteorology or engineering standards. Produce consistent, high-resolution visualizations and export both charts and summary tables for reporting and downstream analysis.
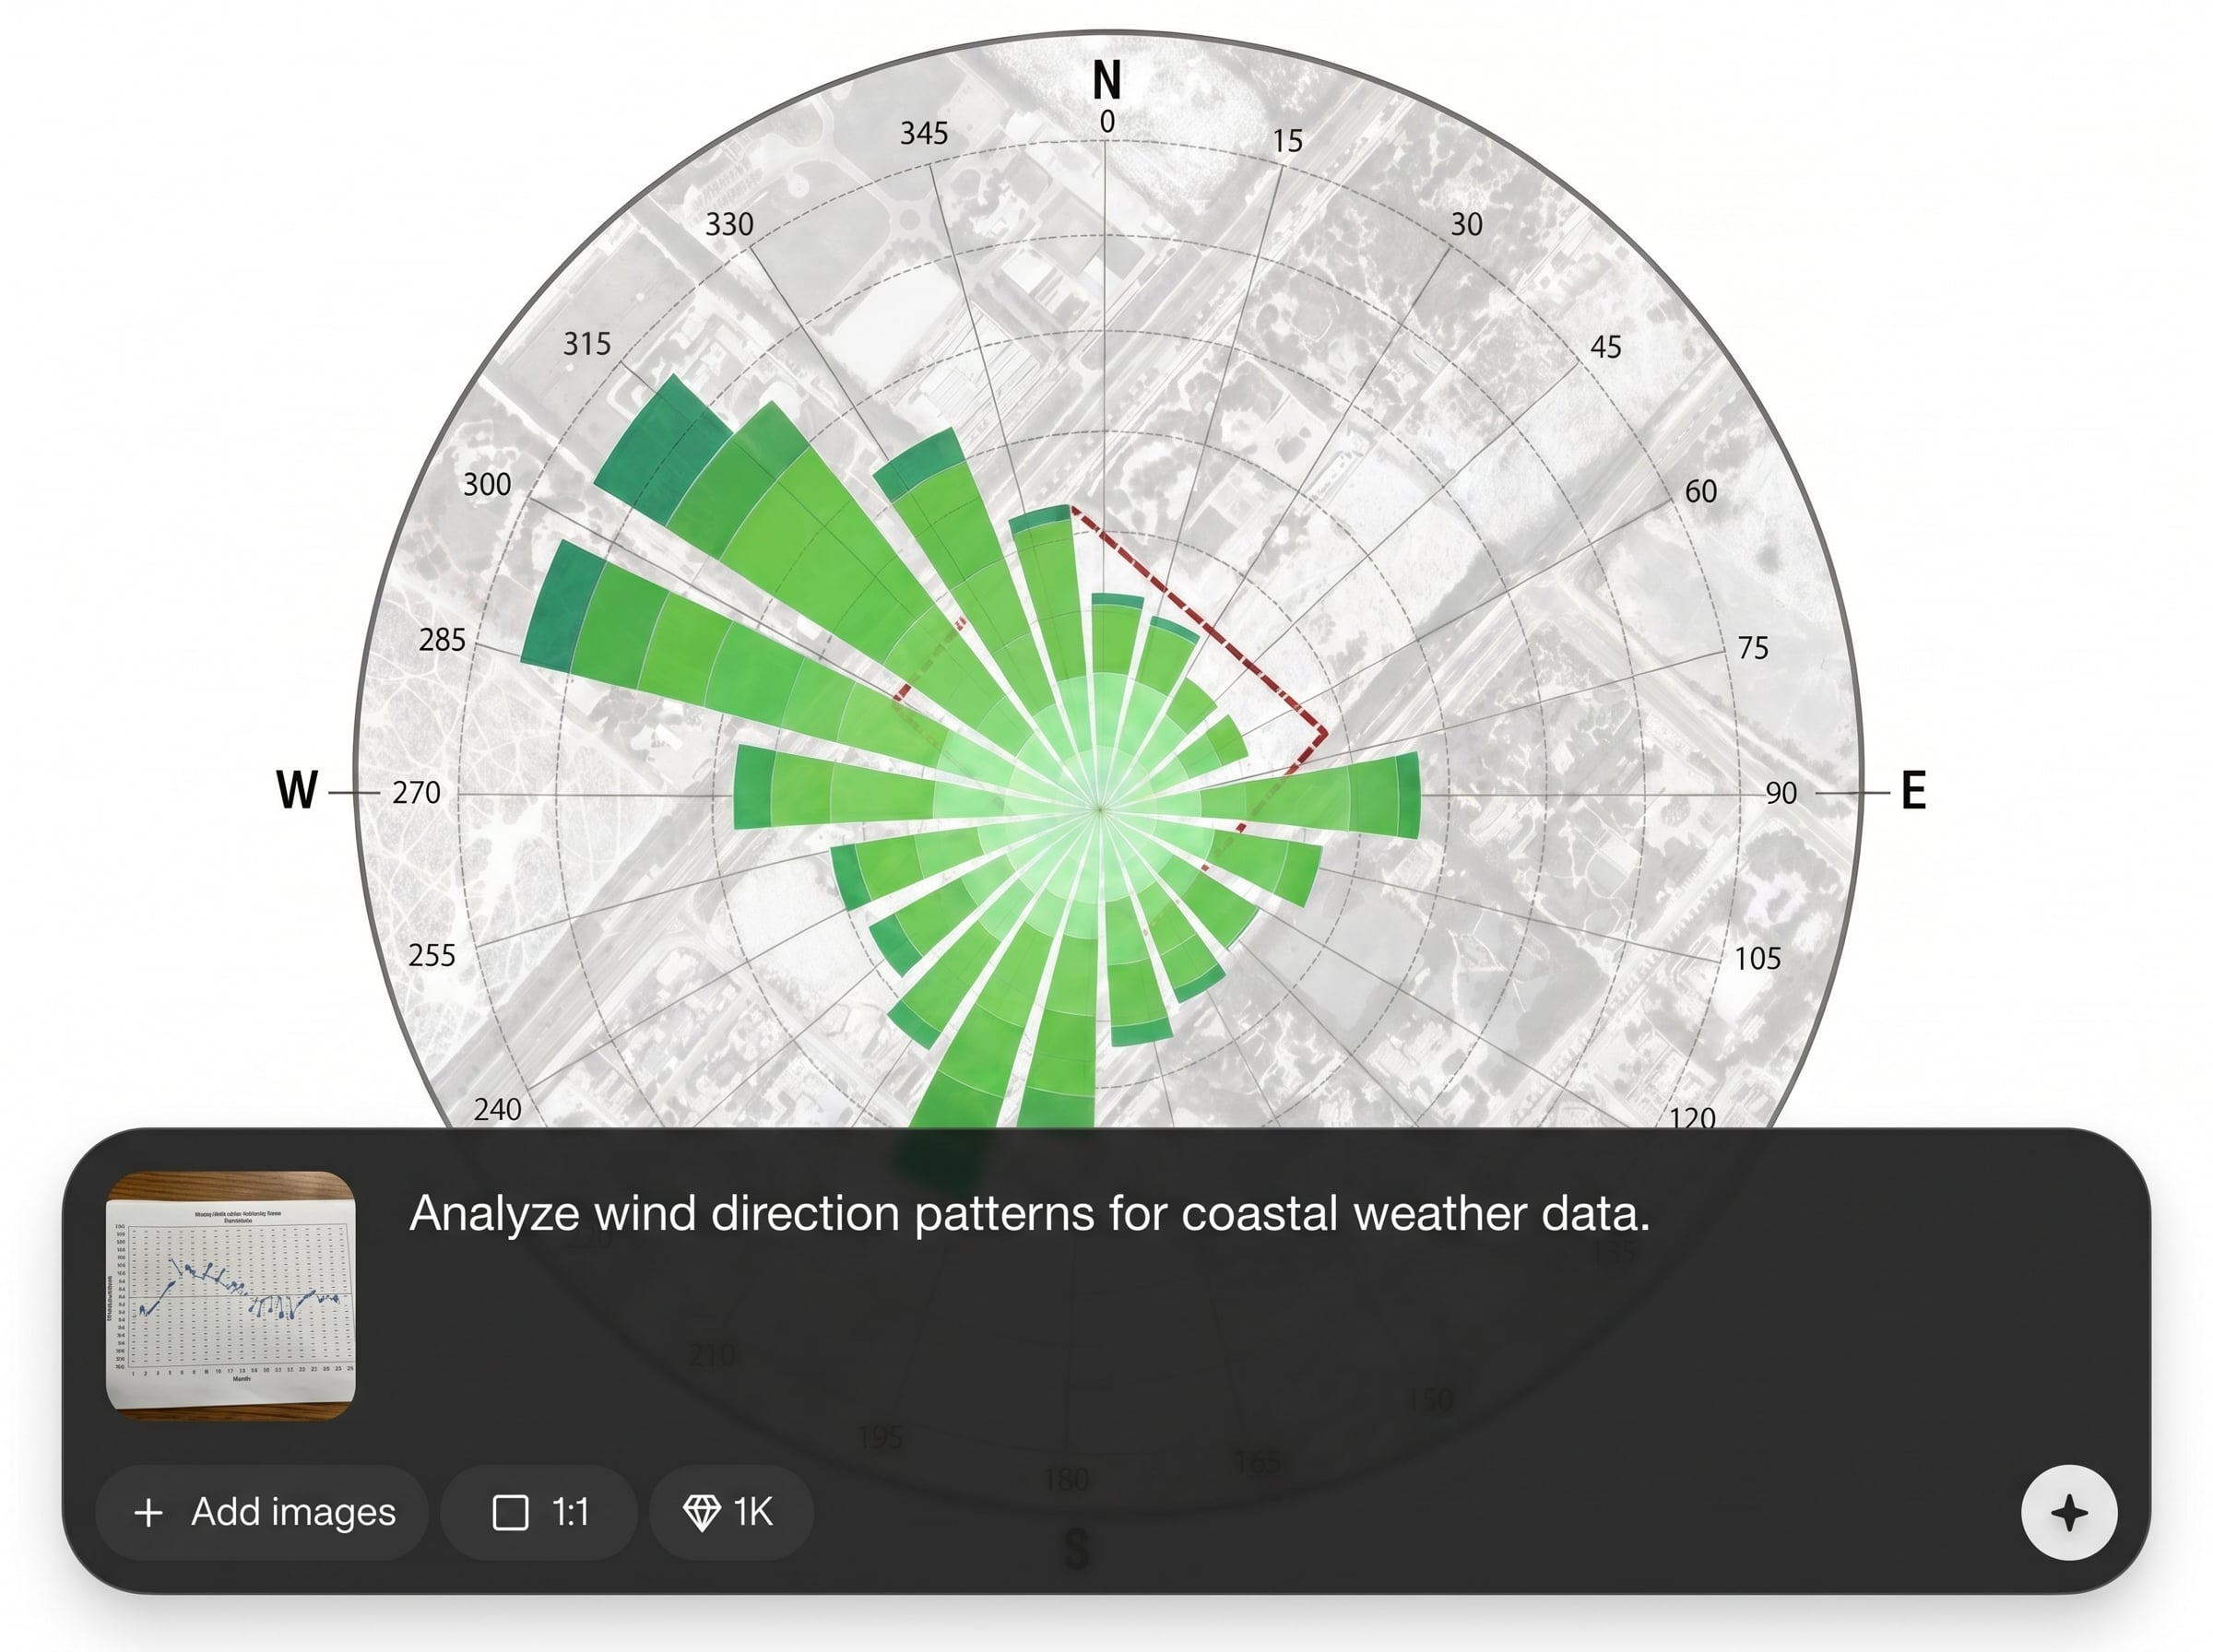
Auto-suggest sector counts and wind speed bins based on your dataset, then refine manually for compliance. Keep frequency totals correct while comparing multiple configurations quickly.
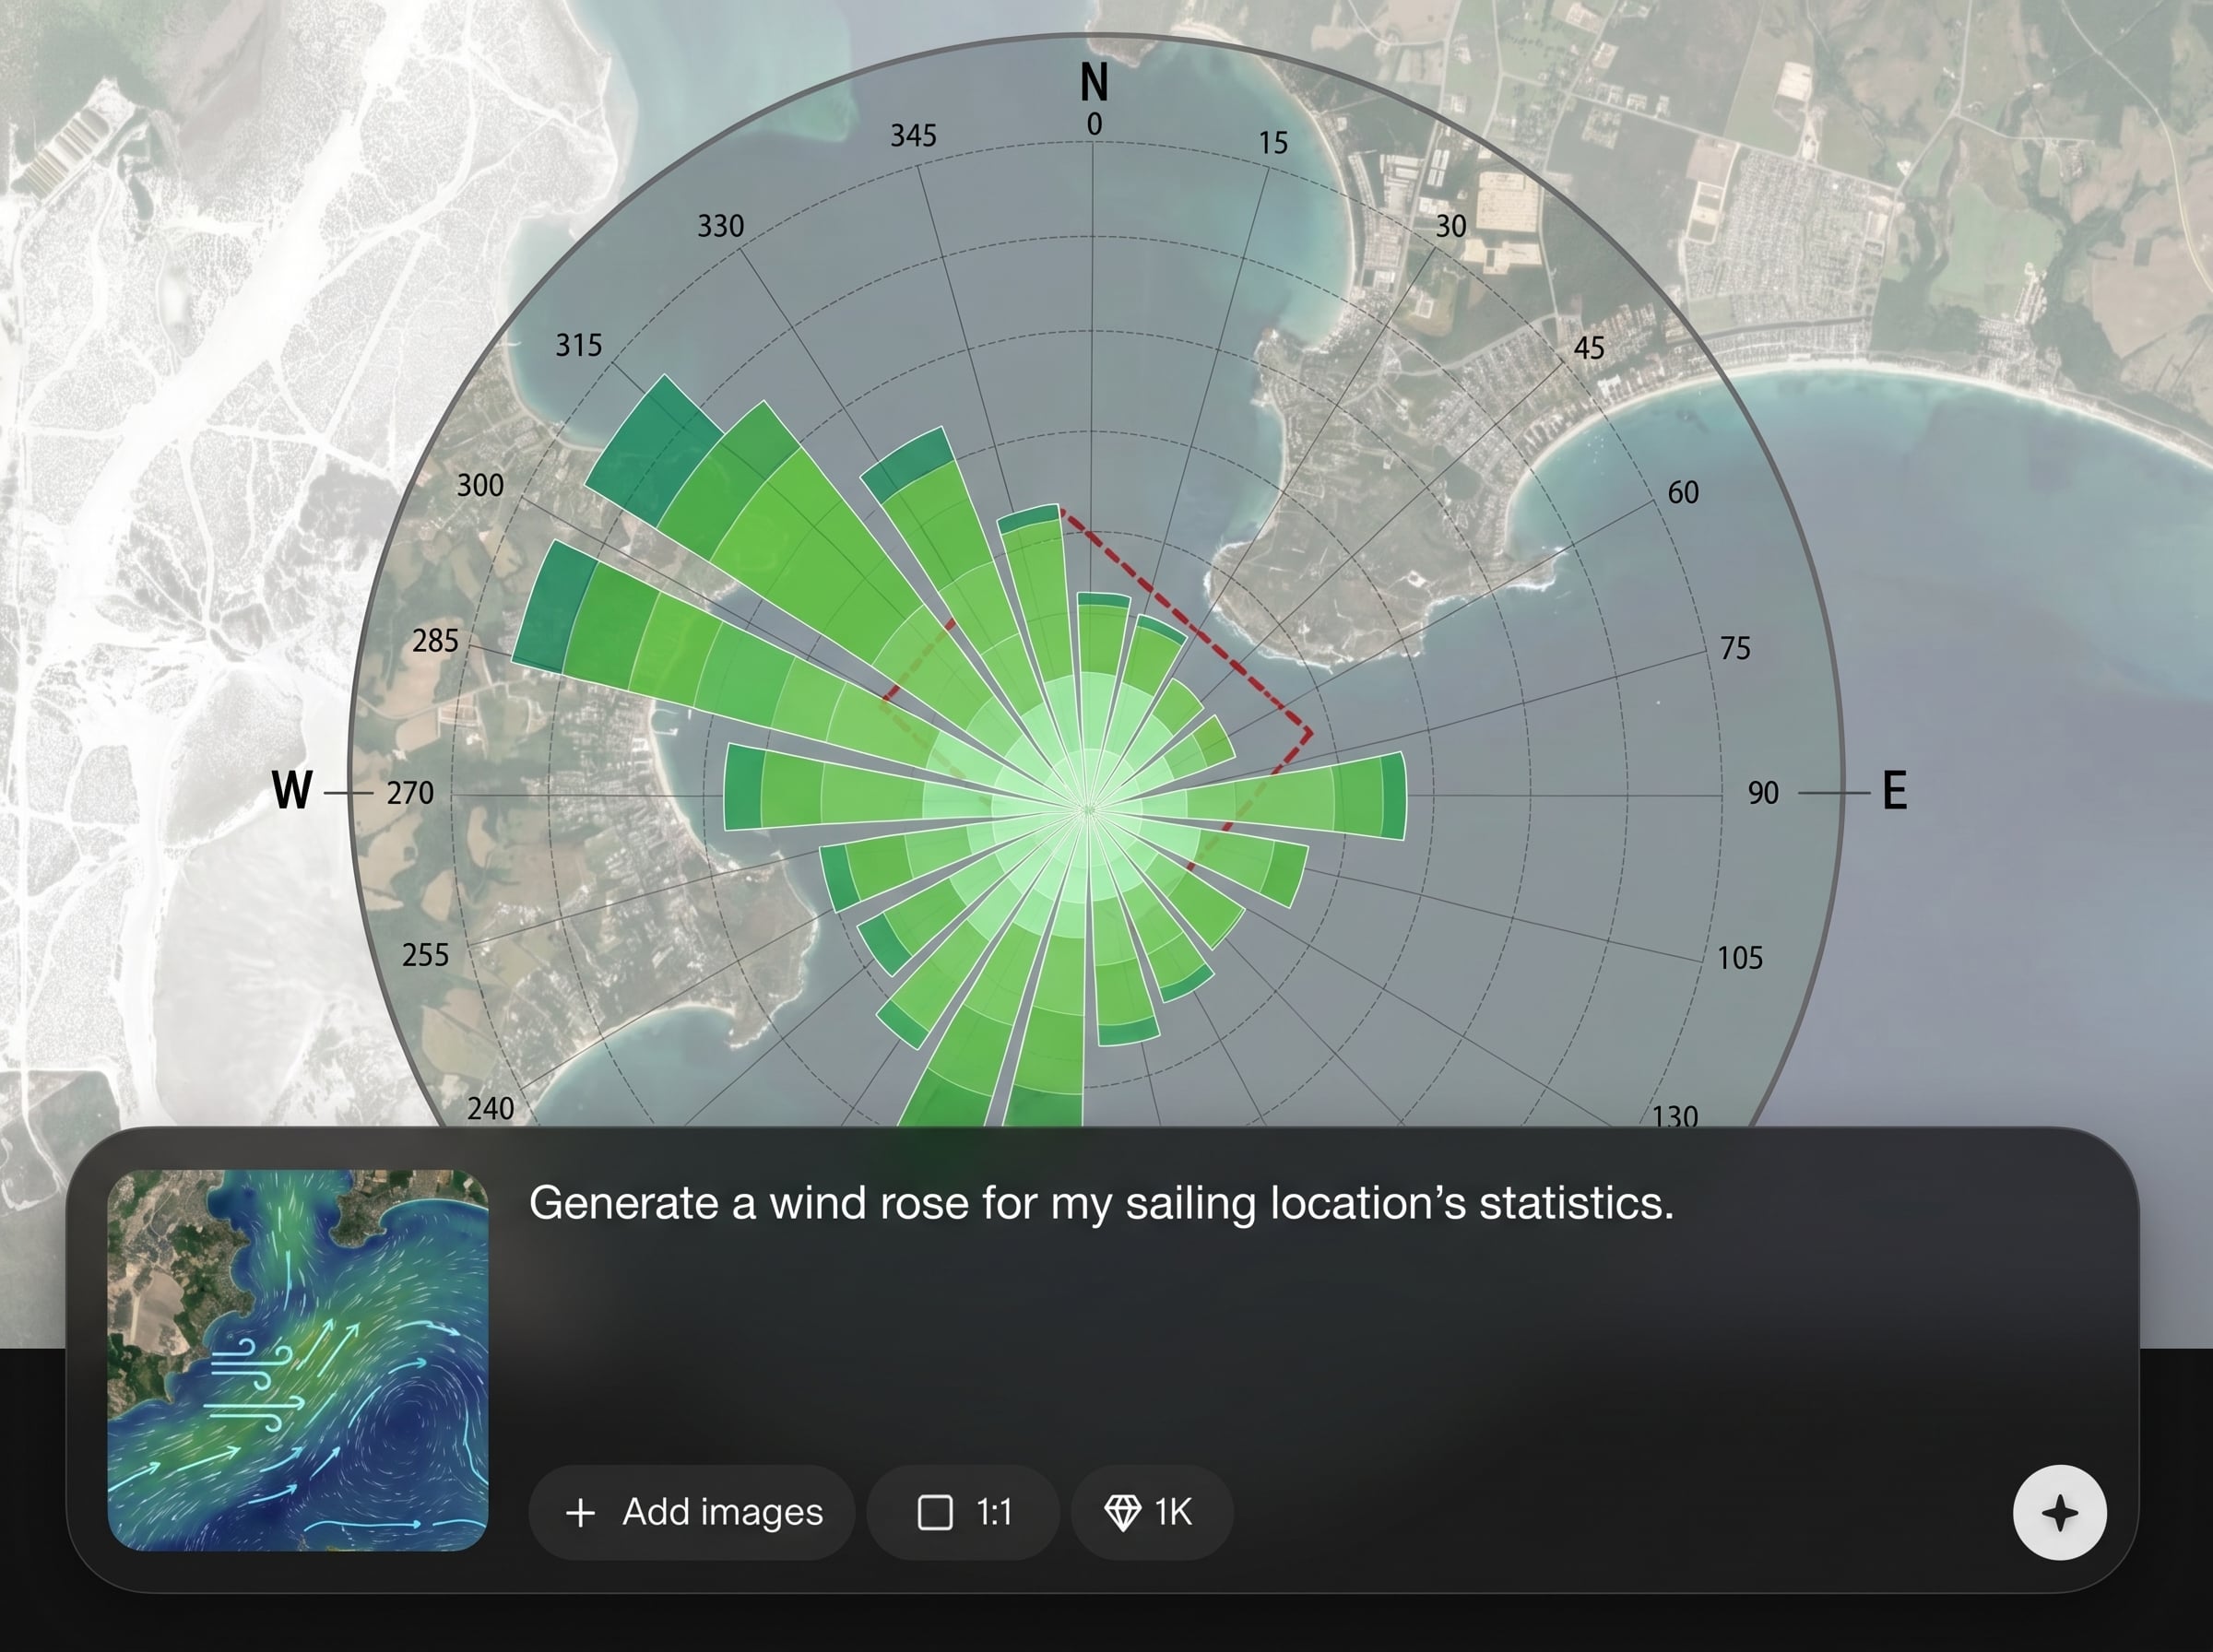
Filter by date range, season, hour, or stability proxy and instantly preview changes. Iterate on wind rose outputs without reformatting data or rebuilding charts from scratch.
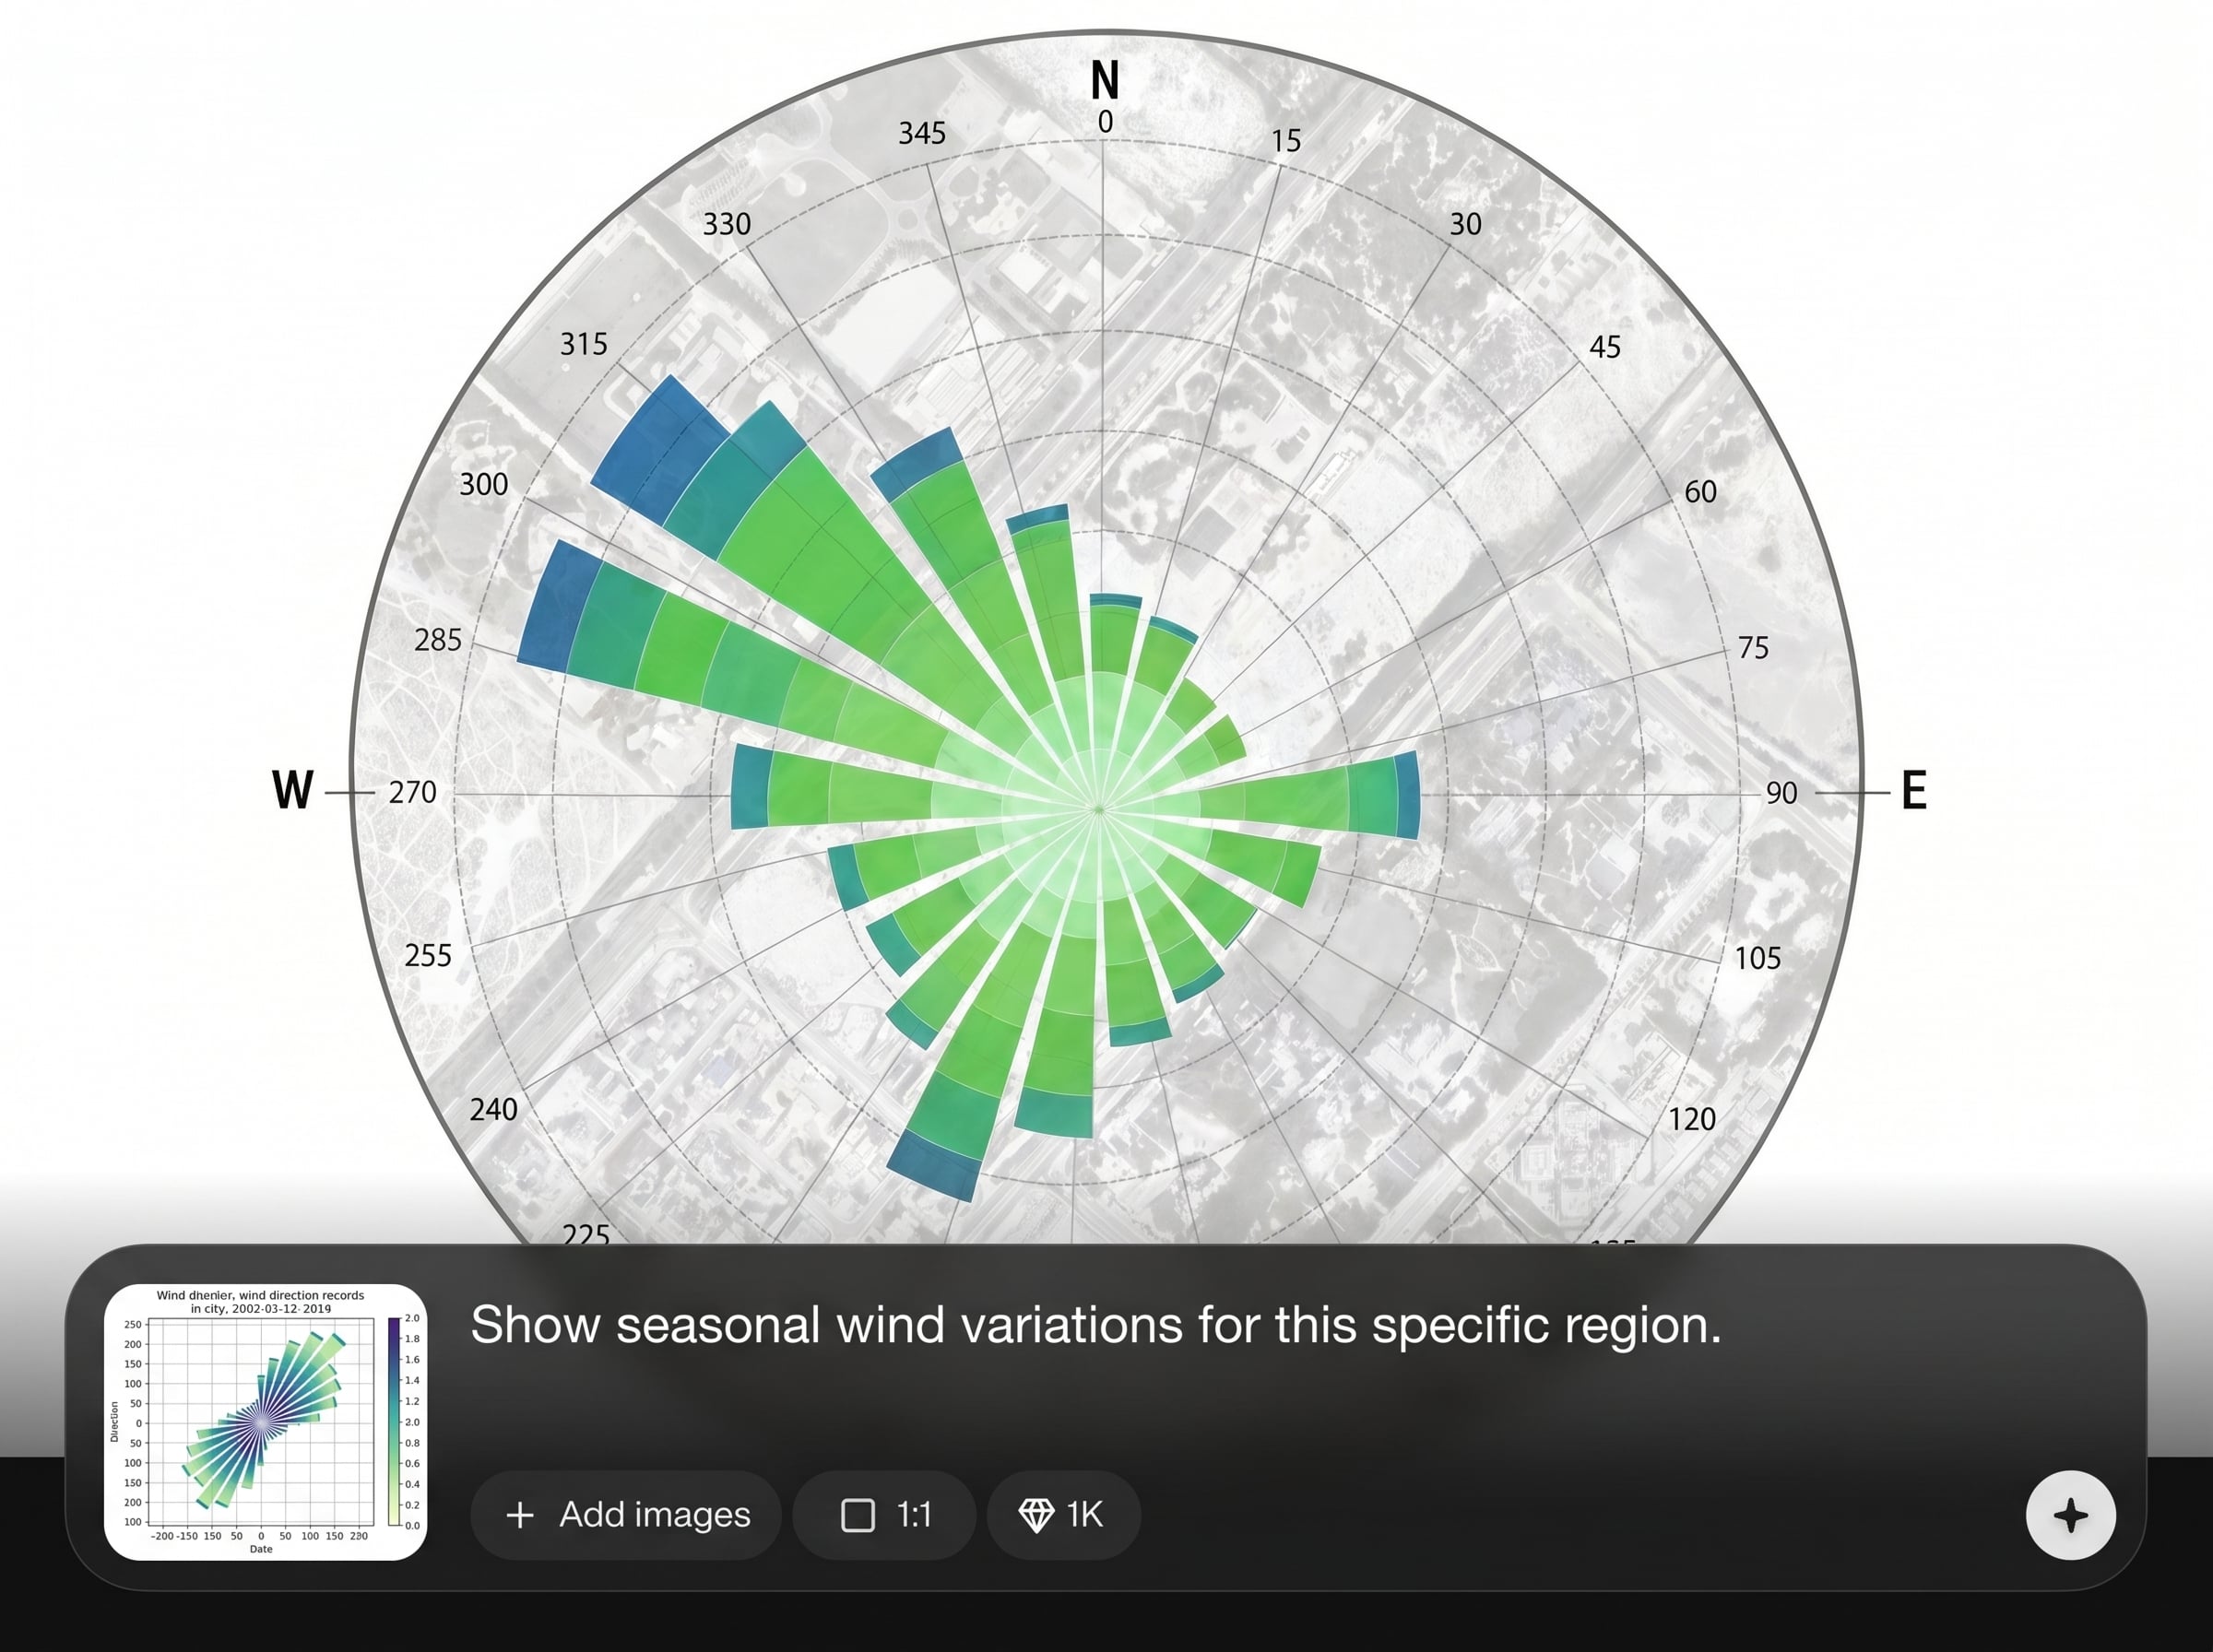
Export clean PNG or SVG wind rose diagrams for reports and slide decks. Download summary tables to support audits, calculations, and machine learning pipelines.
About
Wind Rose Analysis Diagram turns wind speed and direction data into clear, publication-ready wind rose charts using AI-assisted setup. Upload CSV data, choose sector counts, speed bins, and time filters, then generate accurate frequency visualizations in seconds. Export high-resolution diagrams for reports, dashboards, and technical presentations with consistent styling and easy iteration.
Get dependable wind rose analysis with AI-assisted setup, flexible filtering, and export-ready visuals. Work from messy datasets faster, keep outputs consistent across projects, and share results as high-quality charts plus traceable summary tables.
Open the tool, upload your wind dataset, and map direction and speed columns. Select sectors and bins, preview the chart, then export PNG/SVG and the summary table for your workflow.
Use cases
Discover how different creators use this app in their workflow.
Visualize prevailing wind directions to contextualize dispersion, odor, or pollutant monitoring. Generate consistent charts for site comparisons and seasonal reporting.
Evaluate directional frequency and speed distribution for turbine siting and wake considerations. Export diagrams and summaries for technical documentation and modeling inputs.
Support ventilation, comfort, and structural studies with clear wind roses. Filter by time windows to capture critical conditions and communicate results to stakeholders.
Krea is one of the world's leading generative AI platforms. See what others say.
Real reviews on TrustpilotSo many AI tools out there but I always come back to Krea. It's really the one AI platform that 'just works'.

FYN
Krea's interfaces are still the best in the industry. Everything looks and feels so clean and easy to use! Imo the easiest to use gen AI website.

Lynn
Ultra fast generations. Extremely simple to use. All the latest AI models.

Daniel
KREA is the only AI subscription I have right now besides ChatGPT.

Sophia M.
Answers to common questions about generating AI wind rose analysis diagrams and exporting results.
You need wind direction (degrees or compass) and wind speed values, ideally with timestamps. Upload a CSV and map columns, then the tool calculates frequency by sector and speed bin.
Yes. Choose the number of direction sectors, define wind speed bin edges, and set a calm threshold. The diagram updates to reflect your configuration while preserving correct percentages.
Export charts as PNG for quick sharing or SVG for crisp, scalable graphics in reports. You can also download the aggregated frequency table to document assumptions and calculations.
Yes. Apply filters like date ranges, months, seasons, or hours of day to isolate conditions. This helps compare day vs. night patterns or seasonal shifts in wind distribution.
The tool generates publication-ready wind rose diagrams with consistent styling and clear legends. Use configurable bins and sectors to align with common meteorological practices and engineering standards.
Upload wind data, configure bins and sectors, and export a report-ready wind rose in minutes.