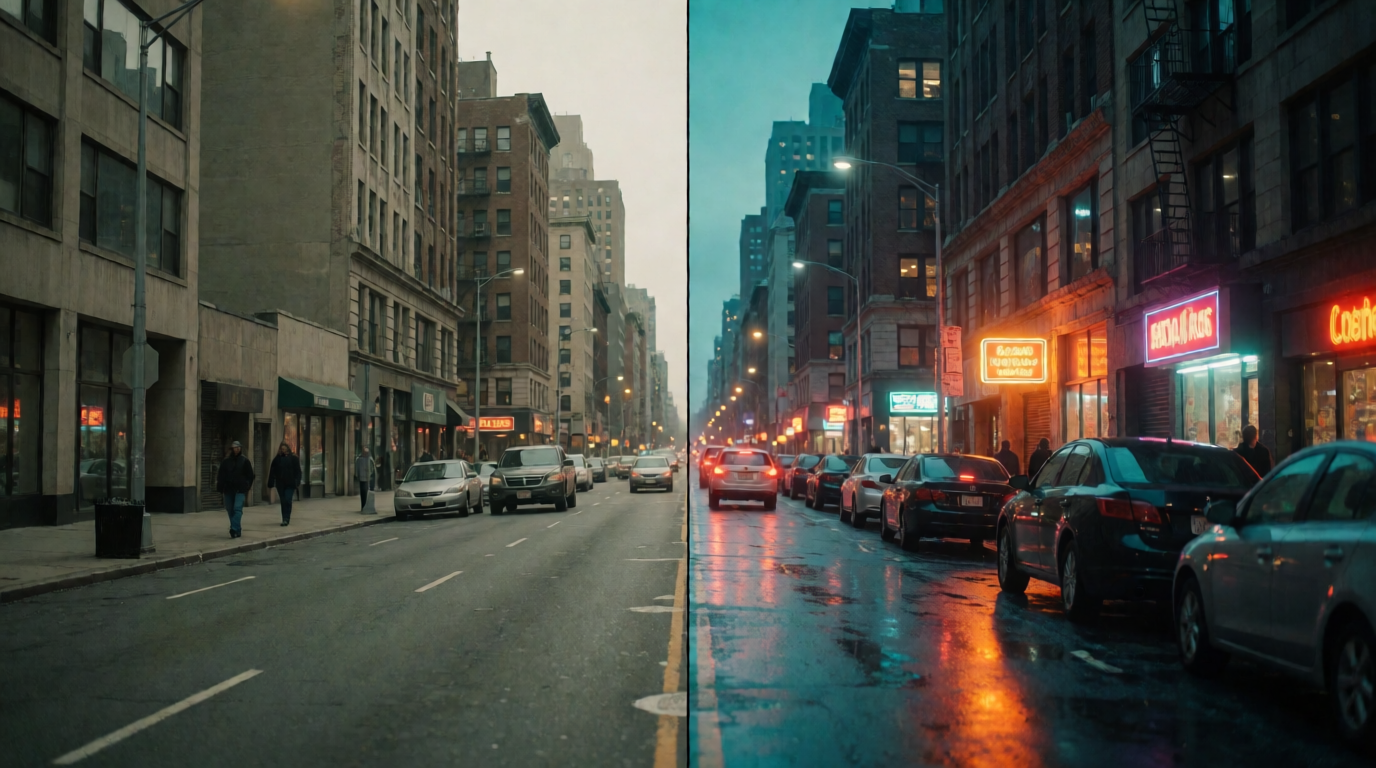
Designing a banner and designing an infographic are different jobs, even though people search for them the same way. A banner is mostly a headline and a color story: it has to grab attention in a few seconds, on a web page or a social feed. An infographic is mostly a data story: it has to hold several facts, icons, and labels in one legible hierarchy. Both jobs split the same way, too — generate the art from a prompt because it doesn’t exist as a template yet, or start from a template because the words and structure matter more than the art. This guide compares five tools across both paths: Krea, Canva, Adobe Express, Piktochart, and Ideogram.
If what you actually need is a poster for a wall or a single-image feed post, our dedicated poster guide compares Krea, Canva, Adobe Express, PosterMyWall, and VistaCreate for that specific job — this post does not repeat it.
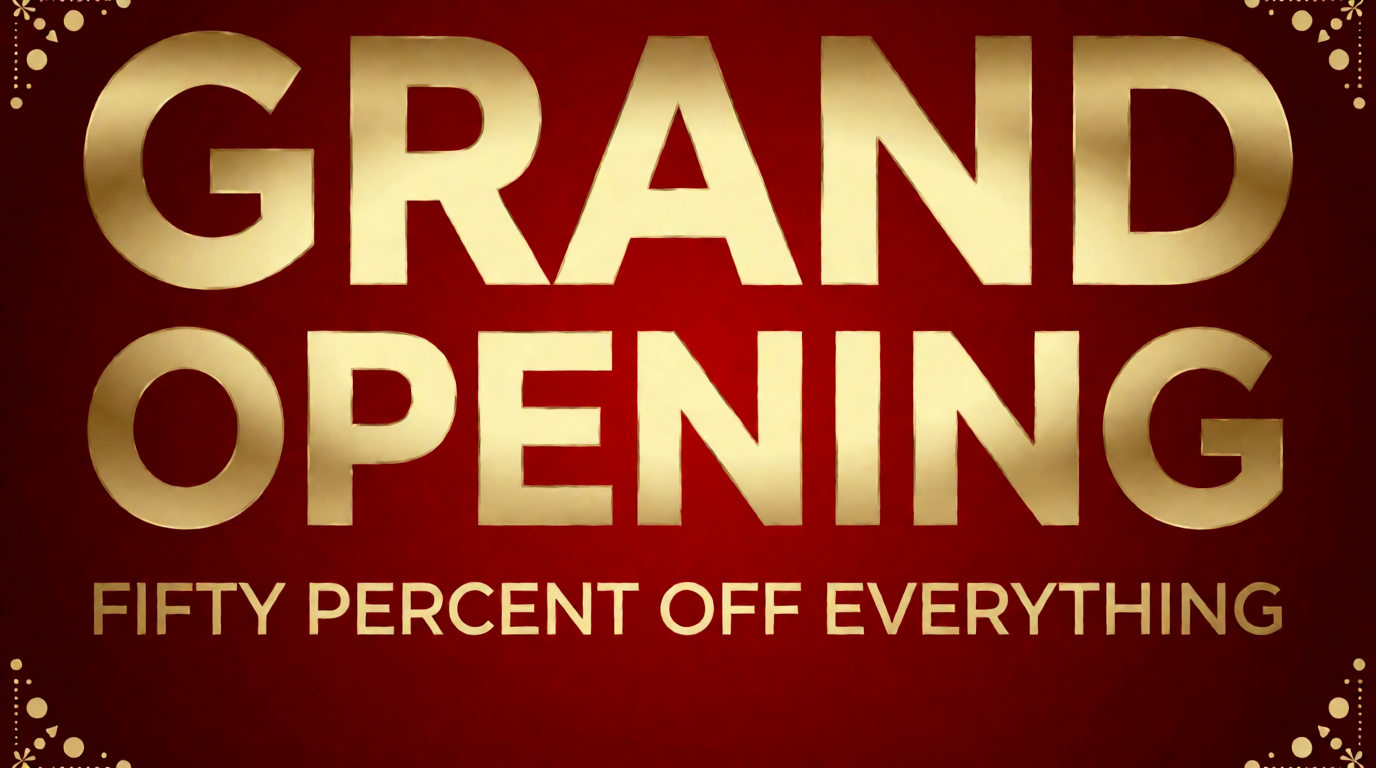
Banner and infographic tools at a glance
| # | Tool | Best for | Price (Sep 2026) | Free tier |
|---|---|---|---|---|
| 1 | Krea | Original banner/infographic art generated from a prompt, in-image text baked in | Free plan; Basic $9/mo; Pro $35/mo | 100 compute units/day |
| 2 | Canva | Drag-and-drop banner and infographic templates | Free forever; Pro $18/mo or $144/yr | Full free tier, no card |
| 3 | Adobe Express | A free, watermark-free one-off banner or infographic | Free; Premium $9.99/mo | Free with an Adobe account, 25 gen credits/mo |
| 4 | Piktochart | Infographic-specific charts, icons, and data widgets | Free; Pro $10/mo (annual) or $15/mo (monthly) | 2 PNG downloads/month, 60 AI credits |
| 5 | Ideogram | The sharpest in-image text for headlines and data labels | Free; Plus $15/mo (annual); Pro $42/mo (annual) | Weekly slow-queue credits, images public |
Generate original banner or infographic art from a prompt
Describe the headline, the layout, and the color story — Krea 2 renders the whole thing, text included, in one pass.
Try Krea 2How we chose and tested
The hardest job for any of these tools is the same: legible text baked directly into the image — a bold headline on a banner, or short data labels on an infographic. That’s the real reason people search for a banner or infographic tool instead of a generic image generator, so it’s what we tested. For Krea, every prompt below ran through Krea 2, and the image beside it is the raw, unedited output — no retouching, no cherry-picking a second attempt. Canva, Adobe Express, and Piktochart are template editors, not generators, so their sections walk the click path instead. Ideogram is a text-focused generator, but it isn’t ours to run through Krea’s pipeline — we describe its documented behavior and a ready-to-run prompt, and no image here is presented as Ideogram output.
Prices below come from each vendor’s own pricing page as of September 2026: Krea pricing, Canva pricing, Adobe Express pricing, Piktochart pricing, and Ideogram pricing.
1. Krea — original banner and infographic art from a prompt
Krea 2 generates the full banner or infographic — layout, color story, and headline typography — from one text prompt, so there’s no template search when the art doesn’t exist as a template yet. A promotional banner is one prompt:
wide web banner design for a summer sale, bright yellow and turquoise gradient background, bold rounded typography reading SUMMER SALE UP TO 40 PERCENT OFF, minimal beach icons of sunglasses, sun, and palm leaf, clean modern e-commerce banner layout, plenty of negative space for a logo corner
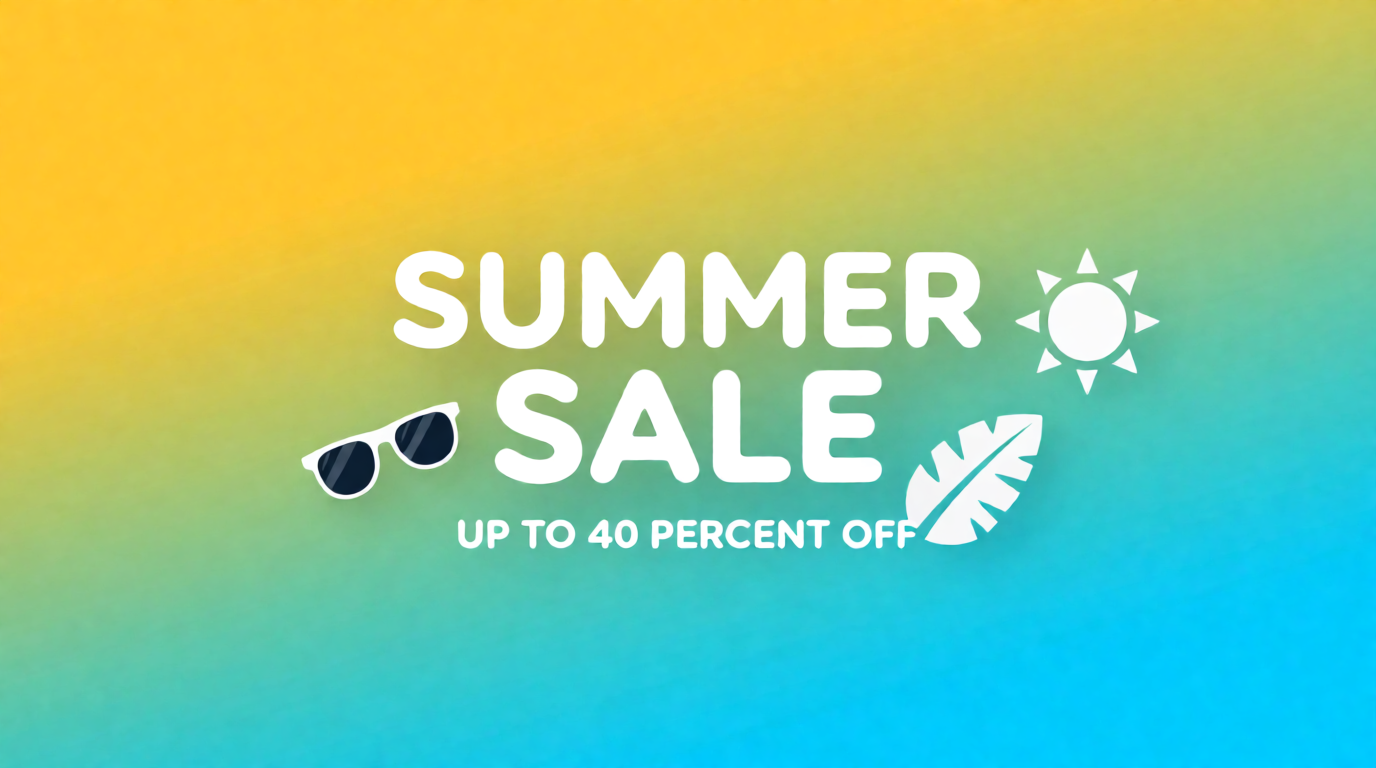
Variation tip: keep the discount line under six words and let the color pair carry the seasonal feel — swap “summer” for “winter” and the palette, and the same structure works for a new campaign.
An infographic prompt names the number of steps and the connector between them:
clean modern infographic explaining a five step morning routine, five numbered circular icons connected by a thin arrow line left to right, bold sans serif step titles above each icon reading WAKE UP, HYDRATE, STRETCH, EAT, PLAN, soft pastel blue and white background, minimalist flat design, high legibility
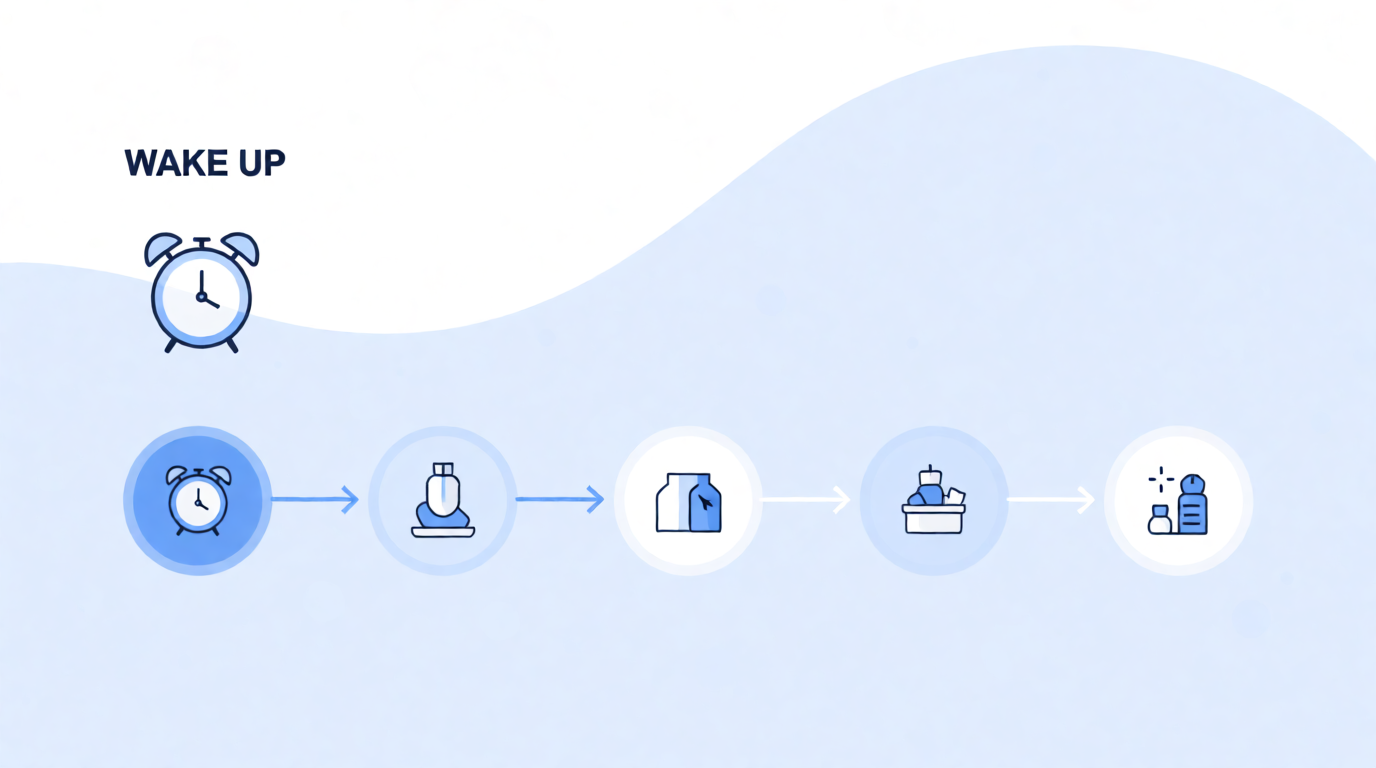
Variation tip: name the exact step count and the connector style — an unscoped “explain a routine” prompt tends to lose the step count partway through the row.
Krea’s free plan includes 100 compute units per day, with limited 3D and lipsync access, no commercial license, and no Nodes (pricing). Basic is $9/month for 5,000 units and adds the commercial license and Nodes; Pro is $35/month for 20,000 units and adds every video model. Once you have the art, Edit can swap a headline or icon as a targeted correction, and the Enhancer upscales it for a large-format print banner.
Where it stops: Krea generates a finished image, not an editable template — no drag-and-drop text box, no saved brand kit, no one-click resize from a web banner to a square crop. Dense small text, like a data table or a legal disclaimer line, still degrades more than a short bold headline. For denser, multi-chart infographics, our Seedream 5.0 Pro on Krea infographic-reasoning showcase walks through 12 examples built for exactly that case.
Try banner and infographic generation on Krea — the free plan covers testing prompts before you commit to a paid tier.
2. Canva — drag-and-drop banner and infographic templates
Canva covers both jobs from one template library: search “banner” or “infographic,” pick a size, and drop your text, photos, and icons into a pre-built layout. Free is genuinely free forever — no card, no trial clock — with a smaller template library than Pro. Canva Pro is $18/month or $144/year (about $12/month effective) and adds the full premium template library, brand kit, and one-click resize; Canva Business runs $25/user/month for shared brand controls.
Settings recipe:
Search “banner” or “infographic” → pick a template sized for your channel (web banner, social post, or presentation slide) → swap the placeholder photo and icons → edit each text box → use Magic Media to generate a custom background element if needed → Resize to add a second format → Download as PNG or PDF.
Variation tip: build the infographic version first, then use Resize to spin off a square social-post crop instead of redesigning the layout from scratch.
Where it stops: every design starts from a template, so infographic layouts are pre-built panels you fill in rather than a chart tool that reads live data — there’s no spreadsheet or CSV import the way a dedicated infographic tool has. And generating genuinely original banner art requires bolting on Magic Media rather than a built-in generation step.
3. Adobe Express — a free, watermark-free one-off banner or infographic
Adobe Express gives a full, watermark-free download on its free plan: pick a template, edit the text and icons, export. Free includes 100,000+ templates, 5GB storage, and a limited number of daily AI generations. Premium is $9.99/month and adds 250 generative credits per month, the full premium template and Adobe Stock library (200M+ assets), and 100GB storage.
Settings recipe:
Open the banner or infographic maker → filter by size (web, social, or print) → swap the template photo and icons → edit headline and data-label text boxes → use a generative credit for a custom background if needed → Download PNG or PDF.
Variation tip: Premium’s generative fill can restyle a template background inside the same editor — useful when a stock photo is close but the color doesn’t match your brand.
Where it stops: the free plan’s daily generation cap runs out fast if you’re iterating on a background, and Adobe Express’s infographic templates are general marketing layouts rather than chart-specific widgets — there’s no bar-chart or pie-chart data import built in.
4. Piktochart — the infographic specialist
Piktochart is the only tool here built specifically around data: import a CSV or paste numbers in, drop a matching chart type (bar, pie, timeline) from its chart library, and swap icons from its built-in set. Free is $0 with unlimited visual projects, 1GB storage, and 60 AI credits, but only 2 PNG downloads per month and free templates only. Pro is $10/month billed annually (or $15/month monthly) and adds unlimited downloads, 500 AI credits, and 100GB storage.
Settings recipe:
Start from an infographic template or a blank canvas → import your data via CSV or paste it in → drop in a matching chart type from the chart library → swap icons to match your subject → adjust the color theme to your brand → Download (2 free PNG downloads per month, unlimited on Pro).
Variation tip: build the chart and data layout first, then swap the color theme last — Piktochart’s themes restyle every chart on the canvas at once instead of one element at a time.
Where it stops: 2 downloads a month makes the free plan a testing ground, not a production tool, and Piktochart isn’t built for banners at all — if the job is a promotional web banner rather than a data-heavy infographic, report, or presentation, this is the wrong specialist.
5. Ideogram — the sharpest in-image text for headlines and labels
Ideogram is a general image generator, but its text rendering holds up at word counts that break most models, which matters for a banner headline or a row of infographic labels. A copy-paste prompt for a banner headline:
bold banner design for a small business grand re-opening, deep teal and coral color palette, large bold display typography reading WE’RE BACK, smaller line below reading NEW LOOK SAME GREAT COFFEE, clean modern layout, high legibility
Variation tip: Ideogram’s text rendering tends to hold up with a 6-8 word subheading — test that length before trimming down to a shorter line.
Ideogram’s free plan gives weekly slow-queue credits, one generation at a time, and images that are public by default. Plus is $15/month billed annually (or $20/month monthly) for 1,000 priority credits and private generation; Pro is $42/month billed annually (or $60/month monthly) for 3,500 credits and batch generation.
Where it stops: free-tier images are public by default, so anyone can see what you generated, and the slow queue means no guaranteed turnaround on a deadline. Like Krea, it’s an image generator, not a layout tool — there’s no drag-and-drop resize between a banner and a matching social crop.
Free-tier limits, side by side
| Tool | Downloads/exports | Free AI credits | Watermark on free exports | Card required |
|---|---|---|---|---|
| Krea | Unlimited, gated by daily compute units | 100 compute units/day | No | No |
| Canva | Unlimited | Template-based, no credit system | No | No |
| Adobe Express | Unlimited | Limited daily generations | No | No |
| Piktochart | 2 PNG/month | 60 AI credits | No | No |
| Ideogram | Unlimited, gated by weekly slow-queue credits | Weekly slow credits (public images only) | No | No |
Which tool should you use? Pick by job
- The art doesn’t exist as a template yet, and it needs bold in-image text: Krea — generate the banner or infographic directly from a prompt.
- You have campaign details and want a fast, clean layout: Canva — the largest free template library and one-click resize.
- One free banner or infographic, no subscription, no watermark: Adobe Express — a full-resolution download on the free plan.
- A dense, chart-heavy infographic for a report or presentation: Piktochart — CSV import and a real chart library, not a template panel.
- Best-in-class text rendering on a headline-heavy banner, no template needed: Ideogram.
- Actually designing a poster for a wall or a feed post, not a banner or data infographic: see our poster guide instead.
A few more banner and infographic styles, generated the same way as the images above — one prompt, one raw Krea 2 output:
More banner and infographic styles

The webinar banner’s prompt:
tech conference webinar banner design, dark navy background with glowing blue circuit-line accents, bold white display typography reading THE FUTURE OF AI, subheading text reading LIVE WEBINAR SEPTEMBER 24, small speaker headshot silhouette on the right, modern corporate event banner style
The statistic infographic’s prompt:
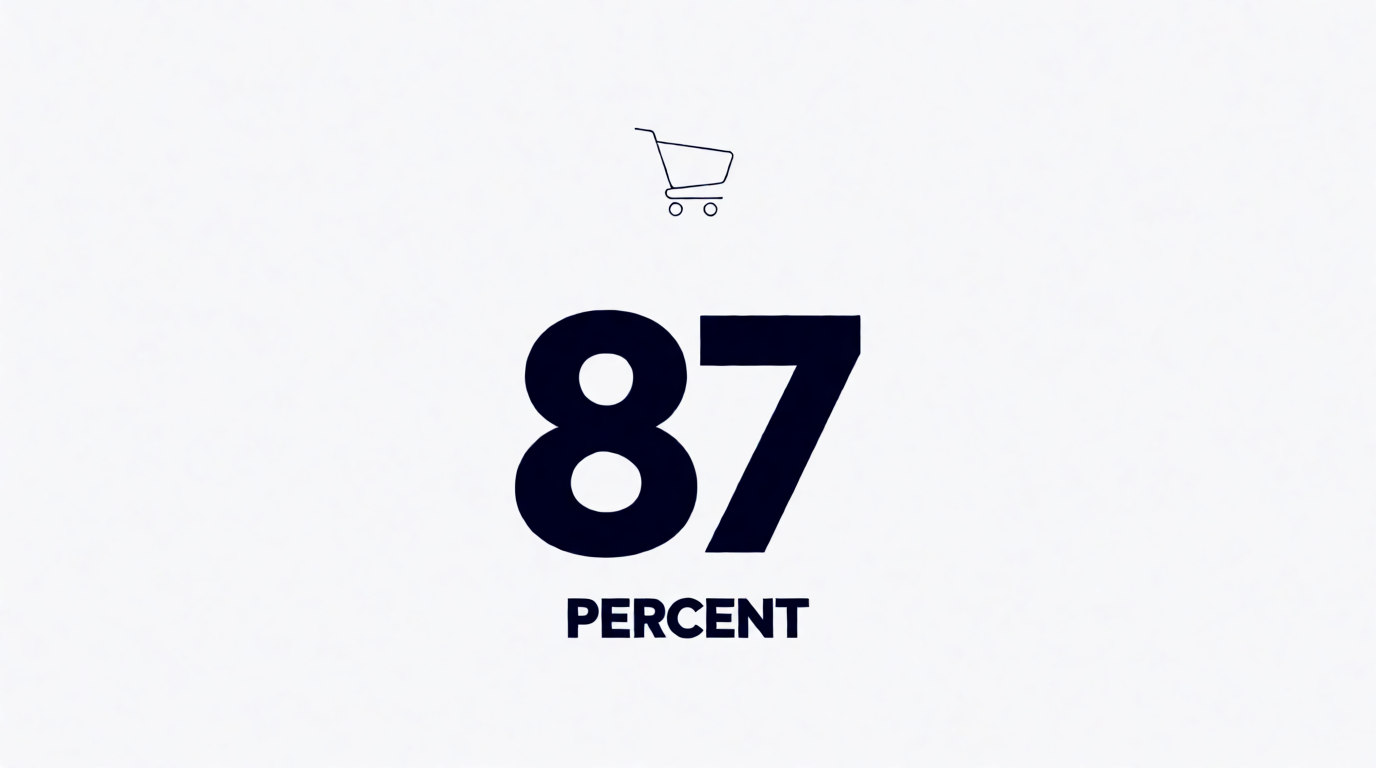
statistic infographic slide, giant bold number reading 87 PERCENT, below it a short line reading OF USERS PREFER FASTER CHECKOUT, minimalist navy and white design, thin line icon of a shopping cart, high contrast bold typography, plenty of white space
Variation tip: for a single-statistic infographic, keep the supporting line short — the model reliably renders a giant number and a short label, but a longer explanatory sentence underneath is the first thing to degrade.
For color pairing before you write a prompt, our aesthetic color palette guide and free AI image generators guide cover the wider landscape if none of these five tools is quite the fit; our 8 best creative AI image generators roundup covers more general-purpose options too.
Frequently asked questions
How can I make my own banner?
Can I create banners online?
How to create an infographic?
How do I create an infographic?
Can ChatGPT make infographics?
Is there a free way to make an AI banner or infographic?
Generate the banner or infographic art, then refine it
Start with a prompt in Krea 2, correct one element in Edit, and upscale for print in the Enhancer.
Start designing